

(Caption for above photo) Teams from Porter Leath, Communities in Schools, Latino Memphis, Knowledge Quest and Literacy Mid-South participated in a series of Beyond the Classroom workshops to spread a culture of results and data within their organizations.
Before we all held Global Positioning Systems in our hands, we used maps and compasses to navigate from point A to point B. And research shows that we had a better handle on directions when we weren’t reliant on a British woman’s voice providing turn-by-turn directions.
Communities need navigation sometimes too. One of the benefits of being a part of the StriveTogether Cradle to Career Network is that you can use the learnings and support of 70 other partnerships across the country to chart a course to advance your own work. Thirty-nine Network members — from Rochester, New York, to Salt Lake City, Utah — contributed to the development of the StriveTogether Data Maturity Model through a series of surveys, focus groups and site visits conducted by The Impact Lab. The model — intended as a compass, not a roadmap — guides communities through the technical, political and cultural aspects of sharing, connecting and using data to drive change and improvement.
Our theory is that to change systems in a meaningful way for every child across the cradle-to-career spectrum, “student-level data must be accessible and used regularly by relevant partners to inform actions to improve outcomes and narrow disparities.”
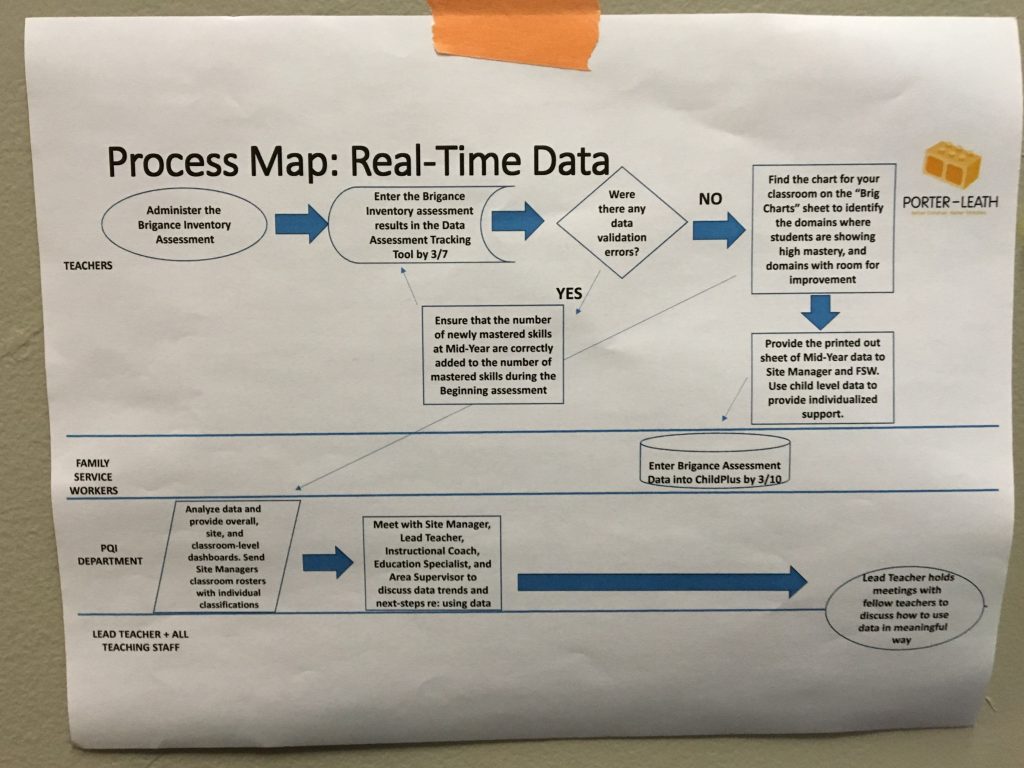
Porter-Leath maps the process to share and access real-time data across key stakeholders to improve kindergarten readiness.
We’ve seen examples of how intentional and consistent use of data across multiple stakeholders can result in better outcomes for kids. For example, at Harlandale Independent School District in San Antonio, teachers, social workers and counselors pulling daily attendance data resulted in 44 percent of students no longer being chronically absent and 72 percent improving their attendance. In Memphis, a community-based nonprofit Porter-Leath built a data culture across its organization over the last year — spreading the use of data from the quality improvement team to teachers, on-the-ground staff and parents. From 2016 to 2017, they saw an increase in kindergarten readiness from 71 percent to 82 percent, which they attribute to teachers having more frequent data to craft interventions earlier and parents being energized by data pep rallies.
And yet, data managers know all too well the roadblocks that prevent education leaders and practitioners from accessing easy-to-digest data to drive decisions: FERPA. Buy-In. Time. Siloed data sets. Trust (or lack thereof.)
The Data Maturity Model allows community partners to self-assess against 14 key aspects of creating a data culture. Those self-assessments can spur conversations amongst relevant stakeholders about potential paths forward in each category, recognizing that there is no single path to data maturity. Each community’s route is shaped by local context and history; it is not necessarily linear and unfortunately no one is going to warn you that there is a traffic jam ahead that will delay your data-sharing agreement by at least three weeks. Rather, the model will show you your true north. If you meet a roadblock, you can return to it to identify alternative routes — but only if at least one of you says in a British accent, “recalculating!”